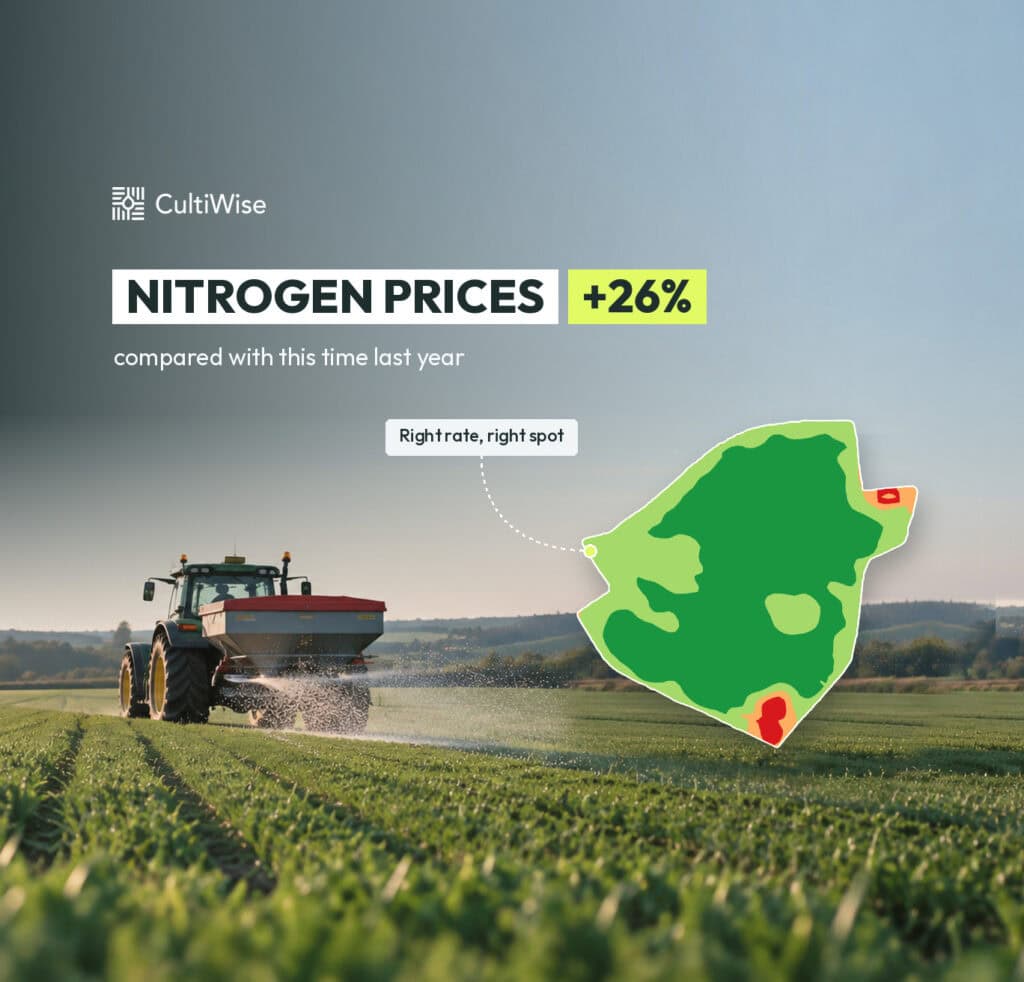
You know which parts of your fields never make the yield. The wet corner, the compacted headland, the stony strip that dries out first. And every spring they get the same 200 kilos as your best ground.
This year those kilos cost 26% more than a year ago.
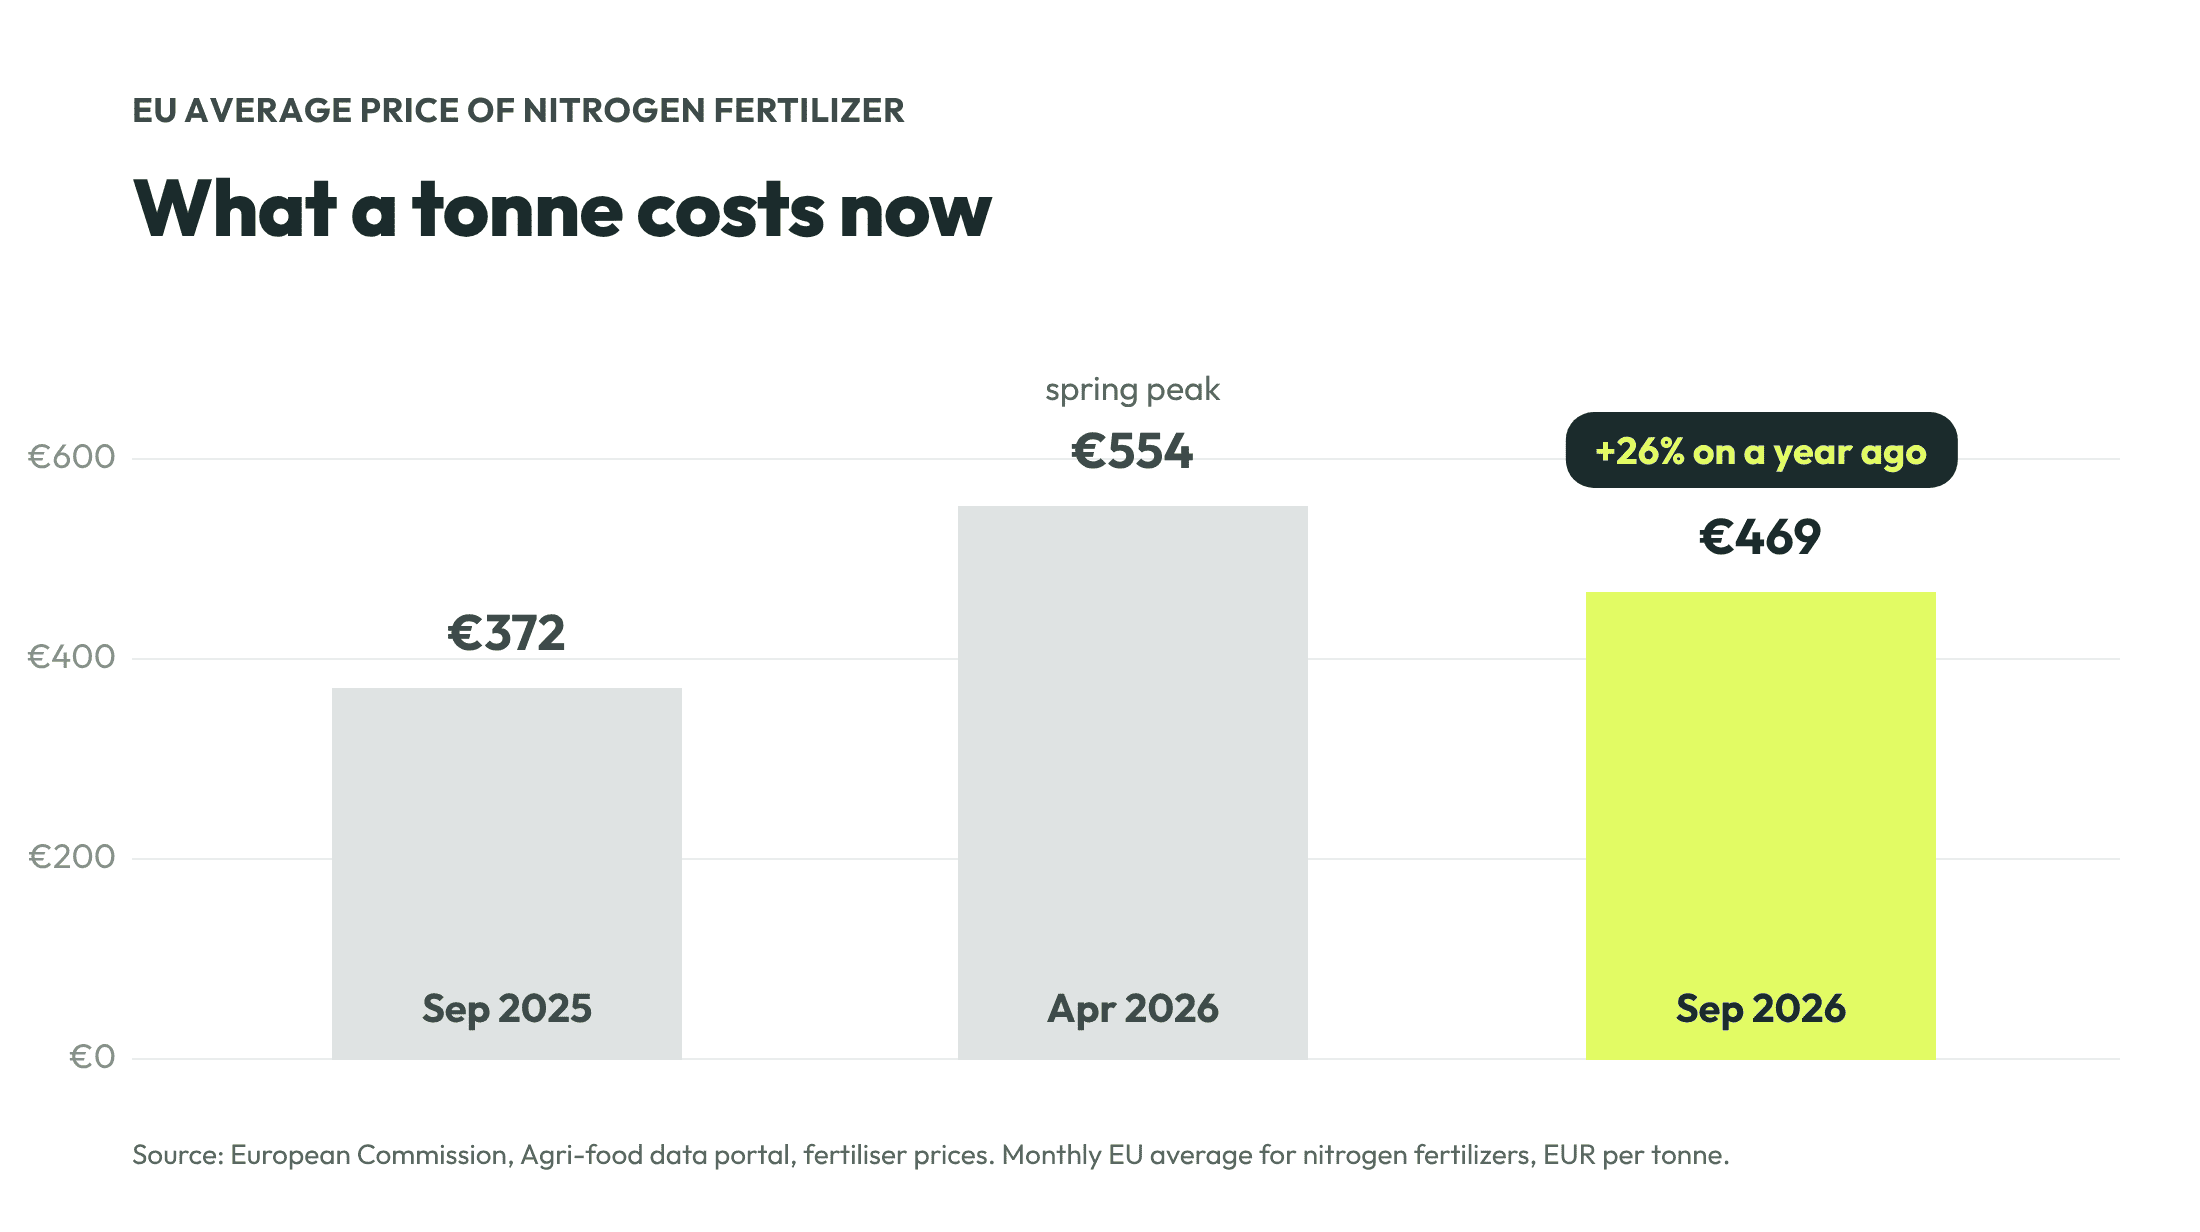
Prices peaked in April, when the Hormuz blockade and a jump in gas prices hit together. They have come down, but not back, and they are climbing again: European gas has more than doubled since June. And most farms are ordering for spring right now.
Variable rate has always paid. At this price, every kilo it puts in the right place is worth more.
Do the sum on your own block
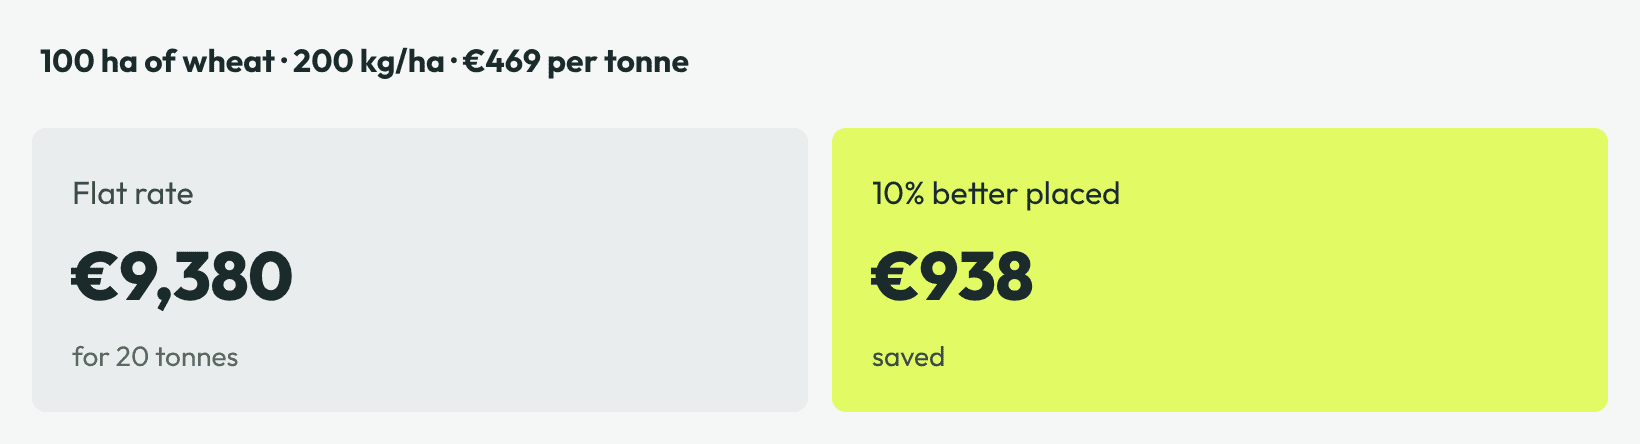
On 500 hectares, 10% is over €4,500. In a normal season our users save between 5% and 30% of the nitrogen on a block. The numbers are in the case studies.
Where the saving comes from
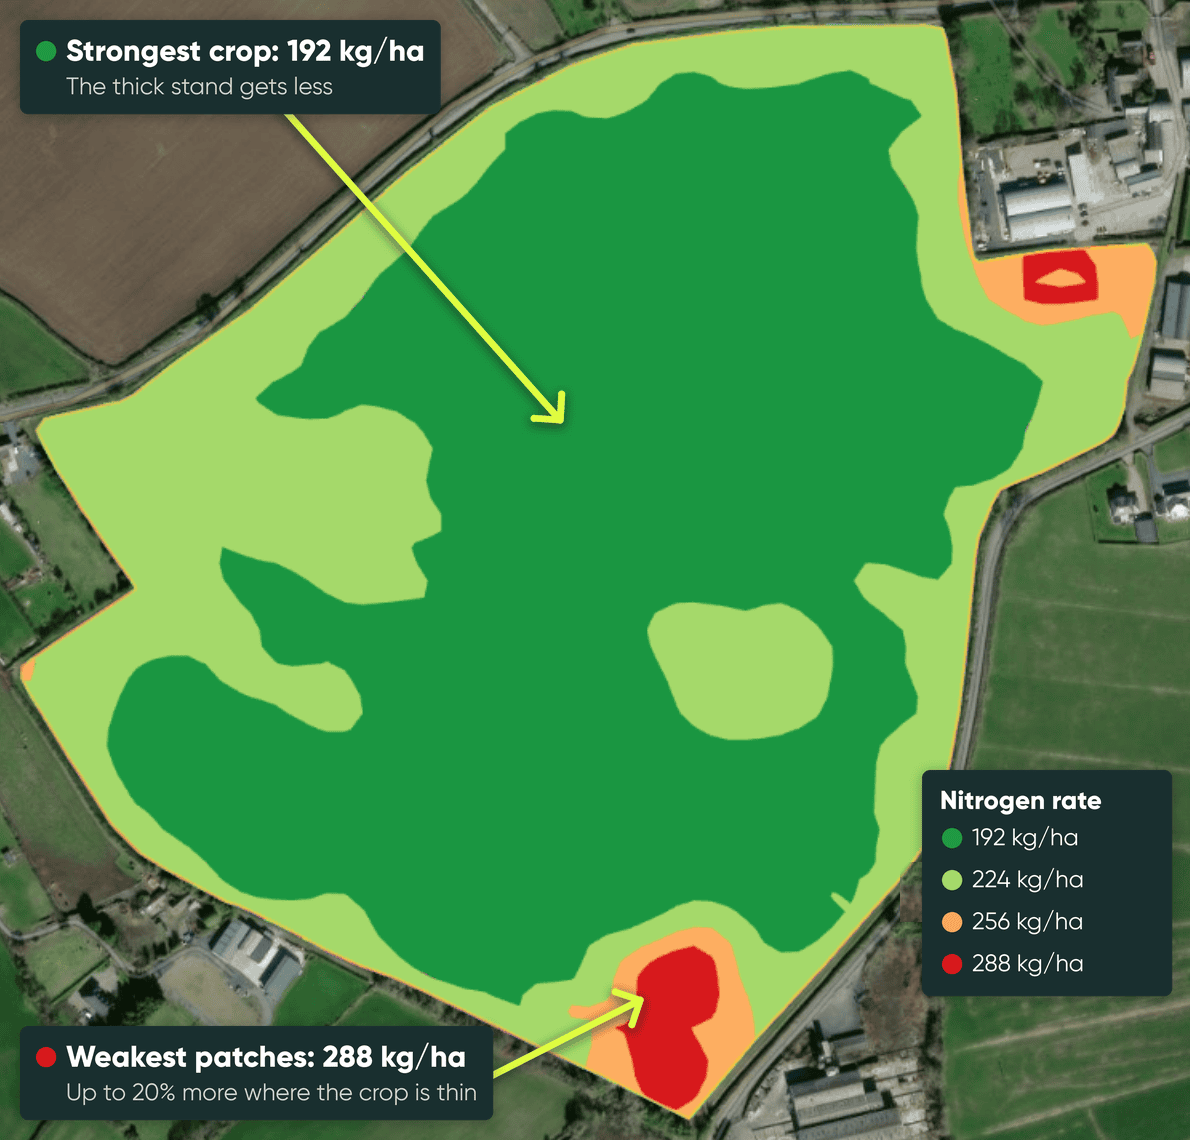
The saving does not come from spreading less everywhere. It comes from moving nitrogen within the field. One of our users grows wheat in Ireland and zoned it at +20% on the weak patches and -20% on the strong ones:
“This wasn’t about simply reducing input. Some parts of the field received more than the 210 kg/ha target rate, while others received less.”
On most of his wheat, that meant taking nitrogen off the thick stand that already had enough, and adding a little on the few thin patches.
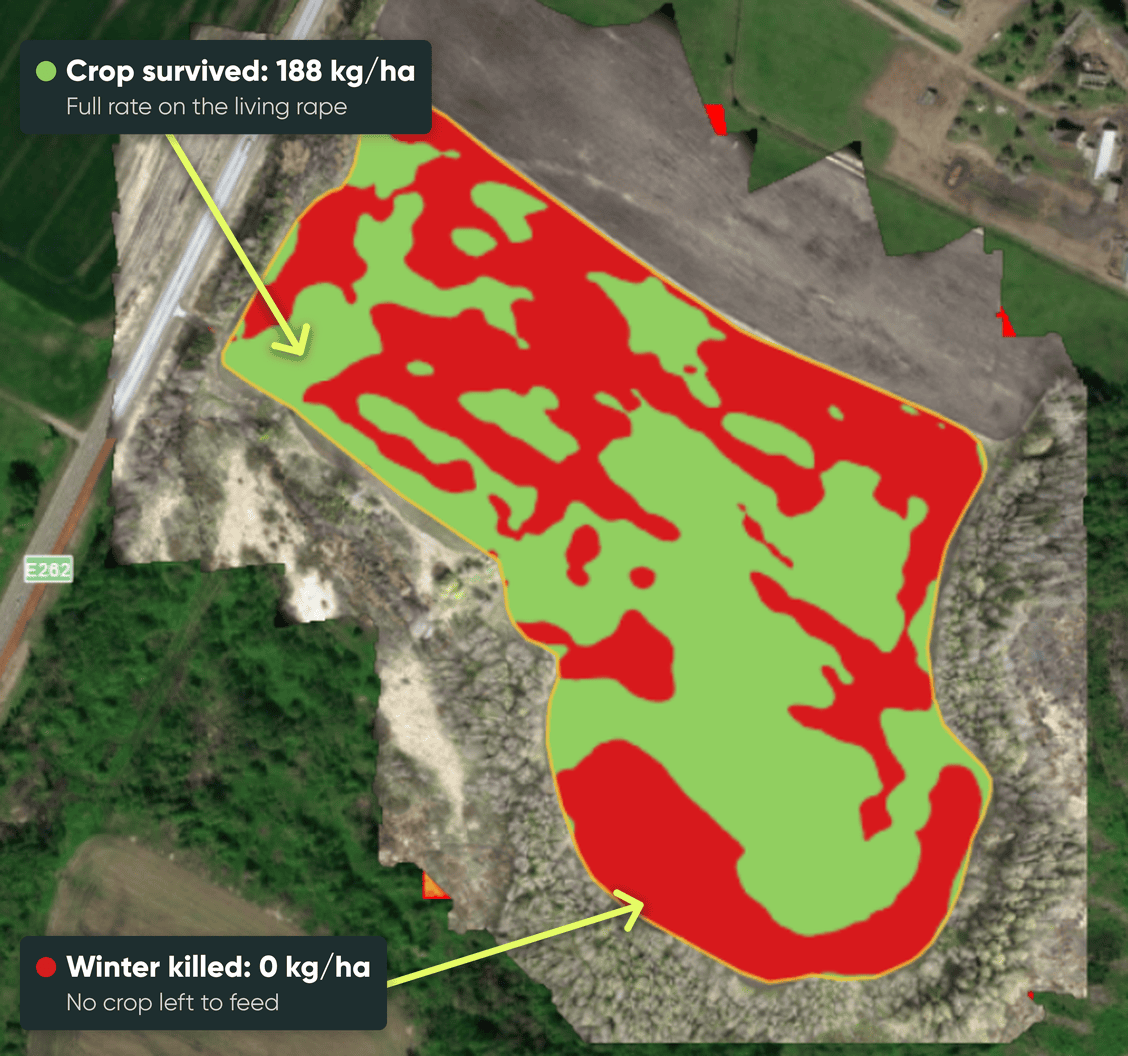
Some ground needs no nitrogen at all: hollows with standing water, bare patches after winter. On one rape field in Latvia, frost and waterlogging left almost half the field without a crop. The map gave that half nothing and the living half the full 188 kg/ha.
Nitrogen on ground like that is simply lost. It washes out with the first heavy rain, and in waterlogged soil up to 5% of it turns to gas every day. Those kilos were never going to become yield.
Everywhere else, it depends on the crop.
Wheat can catch up from a thin start, so at the first fertilizing in spring the thin patches get more and the thick stand gets less. Later the goal is protein, so it turns around: the good zones have more ears to fill and get the higher dose. On milling wheat, an extra 40 kg N/ha adds up to half a point of protein.
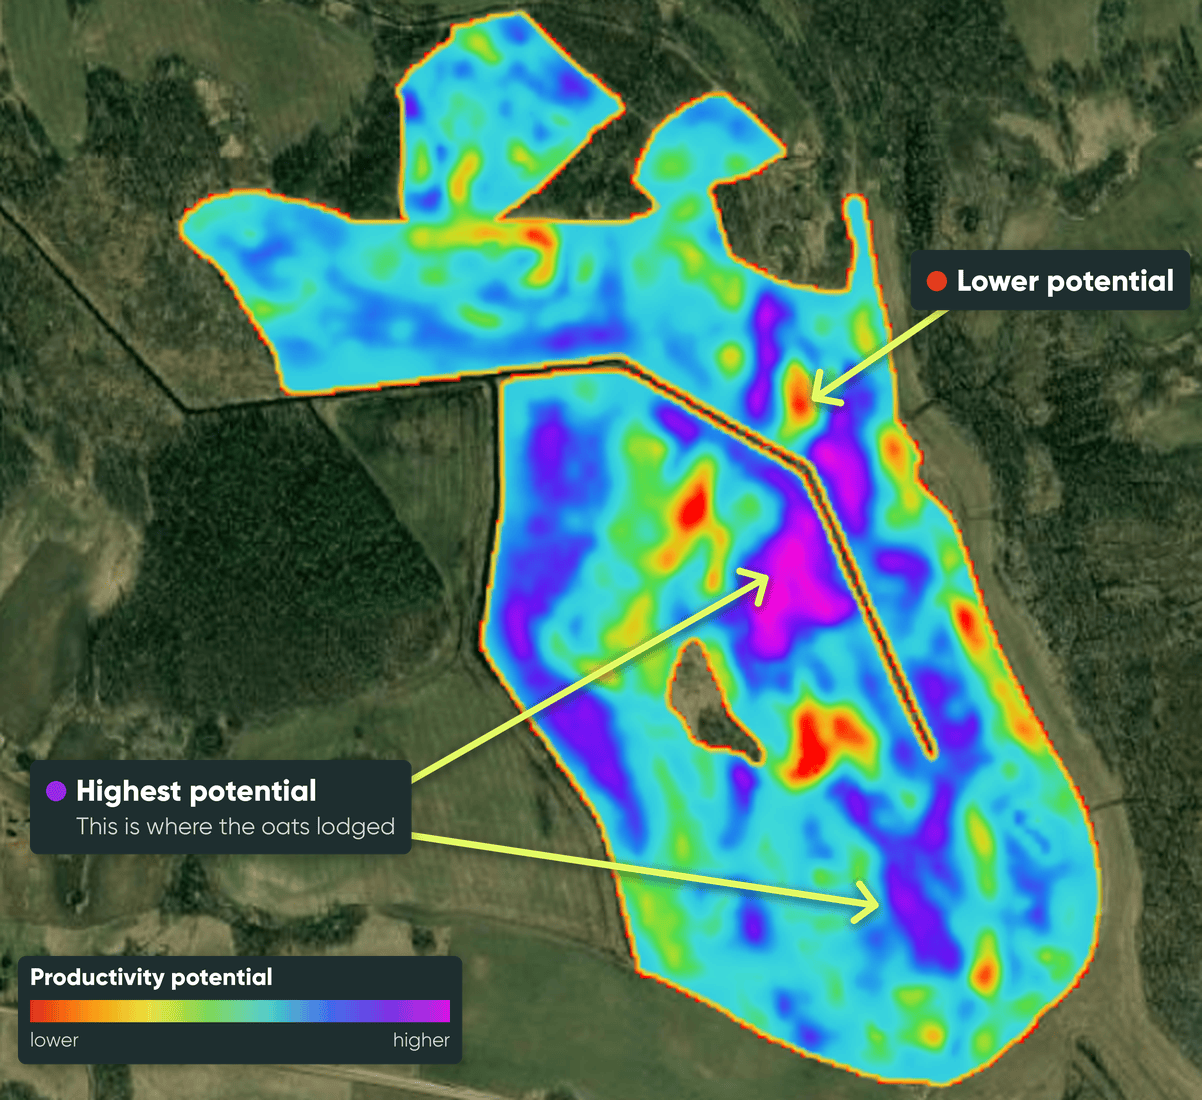
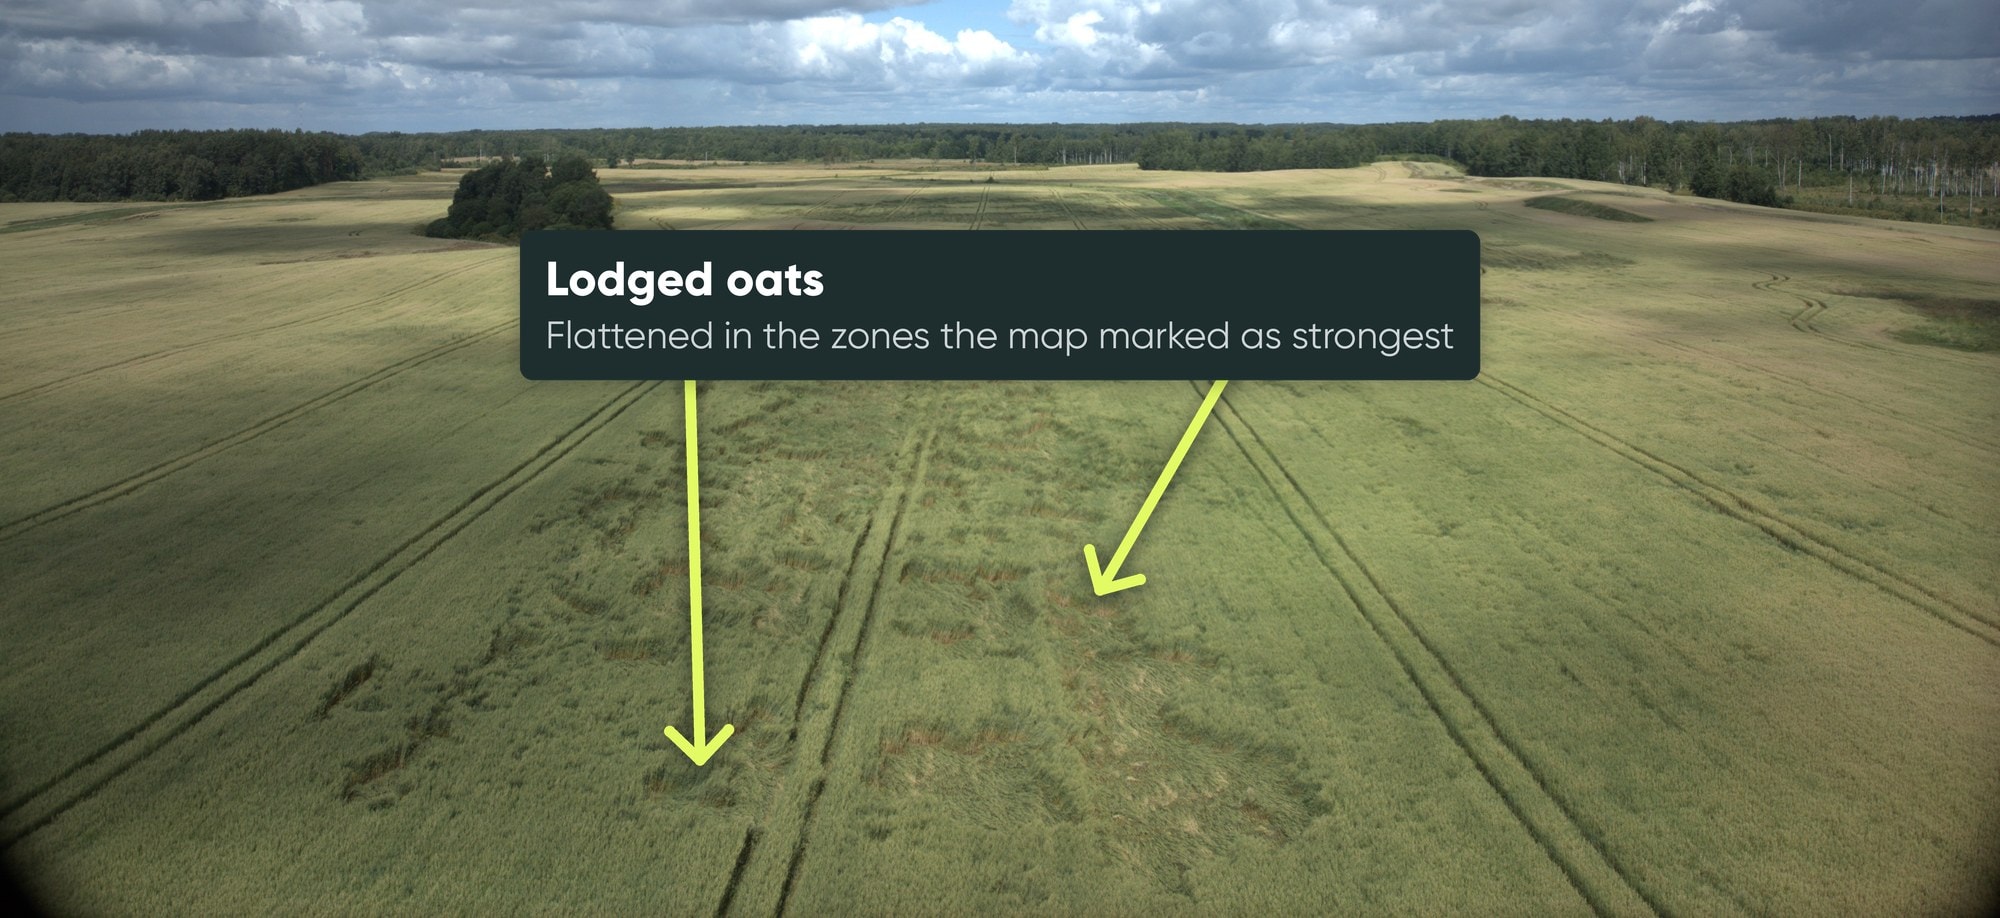
Oats lodge more easily than wheat or barley. An agronomist in Latvia had a productivity potential map showing strong and weak zones, but the field looked even, so he spread one flat rate. The strong zones already had a thick crop, and the extra nitrogen made it even thicker, with taller and weaker straw. After heavy wind and rain, the oats went down exactly there.
Oilseed rape works the other way from wheat. A thin stand does not catch up, so the strong zones get the full rate and the weak ones get less.
So the strategy changes with the crop and with the timing of fertilizing. The goal stays the same: put each kilo where the crop can use it. The lower invoice is a welcome side effect. The real gain is a crop that gets what it needs, zone by zone.
Order on the map
Making the maps takes minutes, not days. The wheat grower from Ireland:
“This morning, I was able to sit down and generate prescription maps for over 500 hectares of wheat in around 30 minutes.”
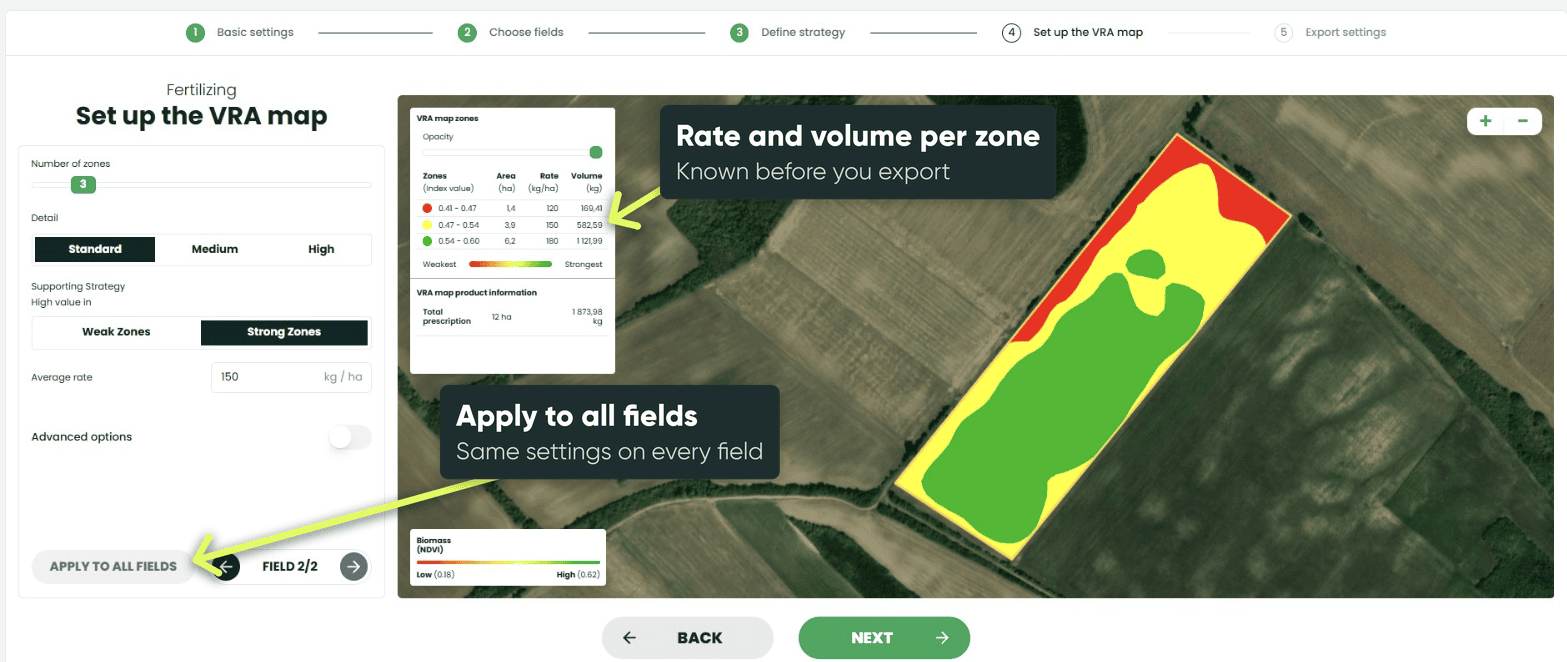
On one 100-hectare block, the map came to 19 tonnes instead of 21. You set the strategy once, apply it to all fields of the same crop, and export them together. It runs on satellite imagery, so there is nothing to fly. And the map works with any spreader that can do variable rate, whatever the brand.
What he values most is knowing the number first:
“I can now confidently tell an operator that a particular block of wheat will require 19 tonnes of fertiliser before even entering the field.”
That is the main difference from an on-the-go sensor, which he used before. A sensor on the tractor reads the crop and sets the rate as it drives. It works, but you only learn the total when the job is done, and every decision is final the moment the fertilizer hits the ground. A map is ready before you start and stays open until the spreader moves:
“If I want to tweak application rates for any field, I can do so easily and immediately see the impact on total fertilizer requirements.”
Before you sign the order
Open portal.cultiwise.com, registration is free, and look at your fields on the latest satellite images. You will see straight away where the crop is strong and where it struggles. With a subscription you also get the productivity potential map, which averages several seasons of satellite images and gives you a good guide for the order. In February, zone on a fresh image of this season’s crop and fine-tune the rates.
Every kilo of nitrogen is dearer this year. Make sure each one lands where it turns into yield.
Source: European Commission, Agri-food data portal, fertiliser prices dashboard (monthly EU average for nitrogen fertilizers, product N: €372 a tonne in September 2025, €469 in September 2026, +26%; data retrieved 16 October 2026).