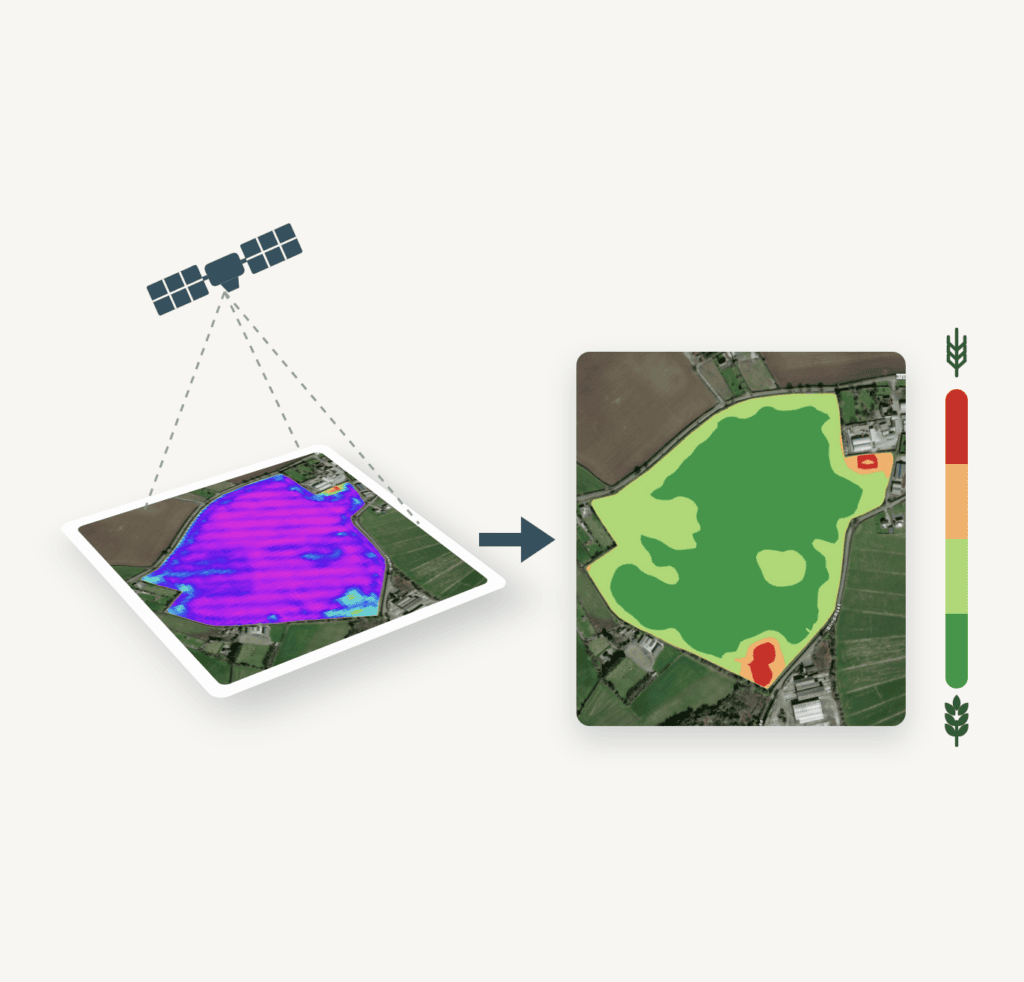
From the cab, you see your crop up close. But by then you’re already spraying or spreading, and it’s too late to change the plan.
The satellite shows you the same crop before you go out. You see which parts need more and which need less, and you set the rate before the tank is full.
Reach for it before every nitrogen, growth regulator or fungicide pass, after a hard winter, and before harvest.
Every picture of your field, in one place
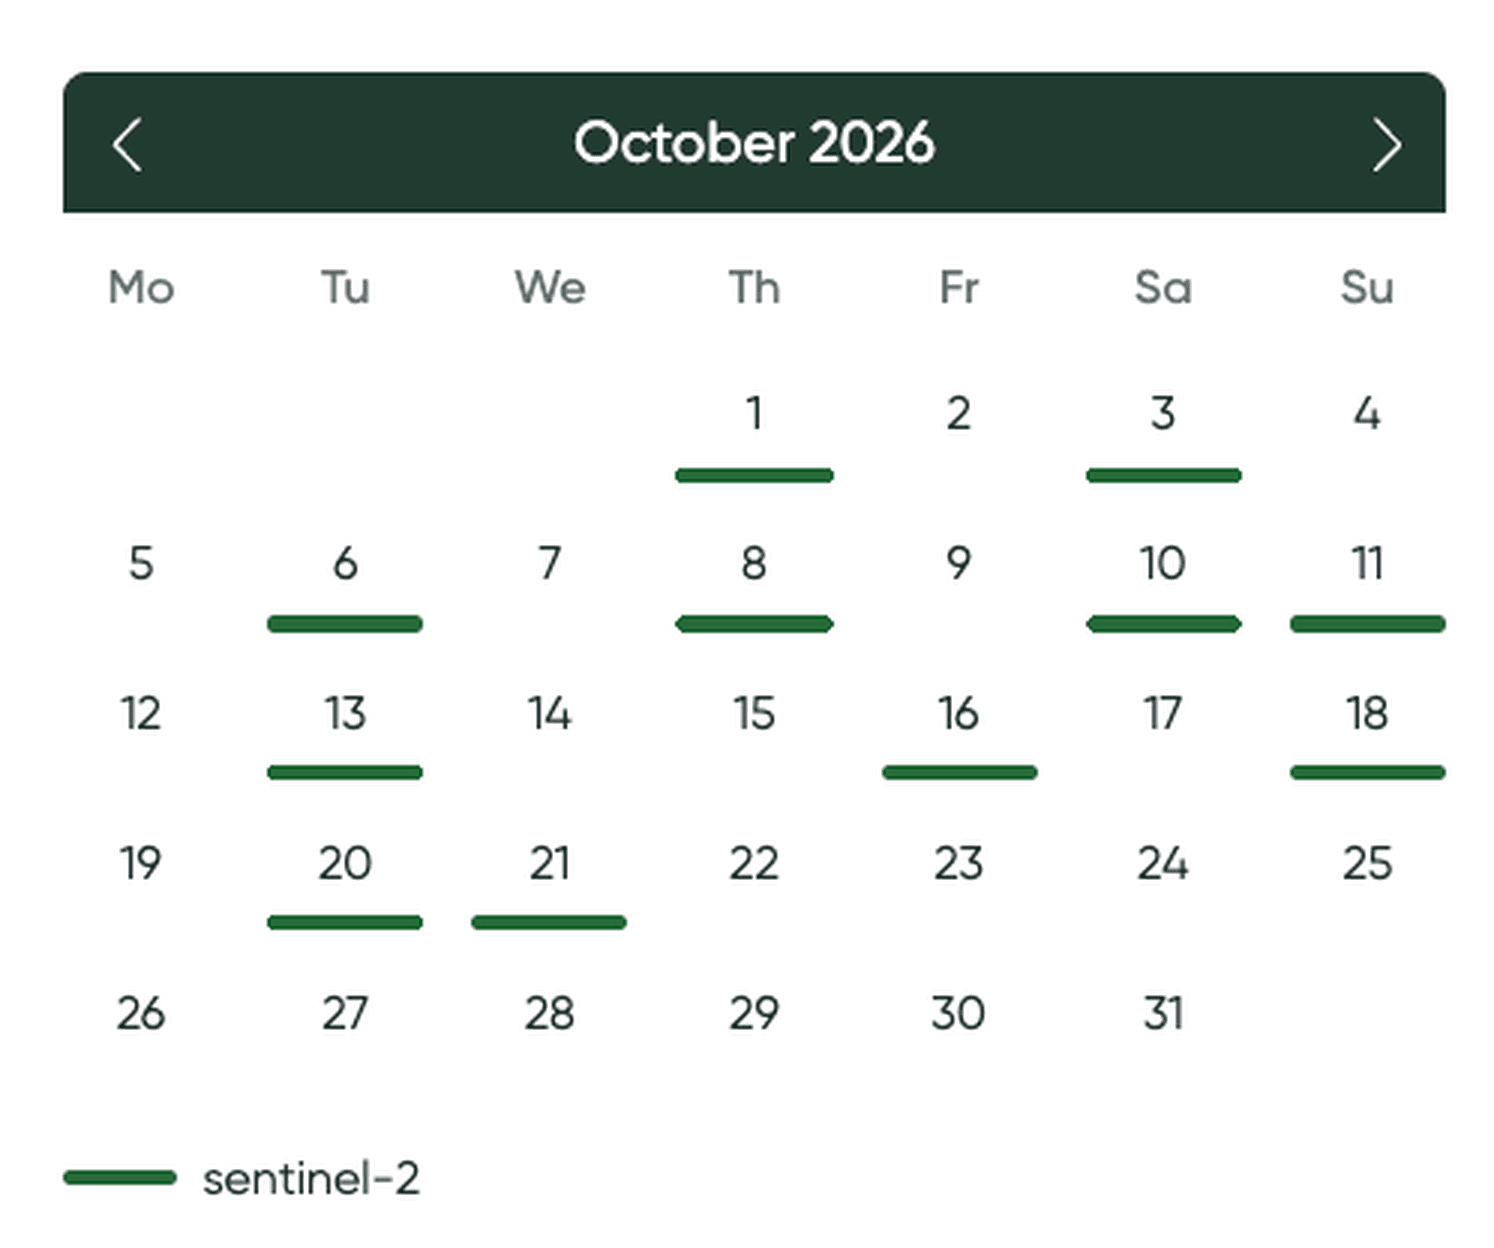
The satellite passes over your farm every two to three days and takes a picture of every field. CultiWise collects them for you. Add your field borders once, and the pictures are there, this season and the seasons before.
Each field has a calendar with every date that has a picture. Open the latest clear one. The satellite can’t see through cloud, so if your field was under cloud that day, the calendar shows you that too.
What the picture tells you
The picture shows the crop as it stands on that day: where it’s thick and green, and where it’s thin or pale. You know your field, so you’ll usually know why. The picture shows you where, and how big.
Put it next to your productivity potential map. Most years the two look much the same. After a hard winter, though, they often don’t.
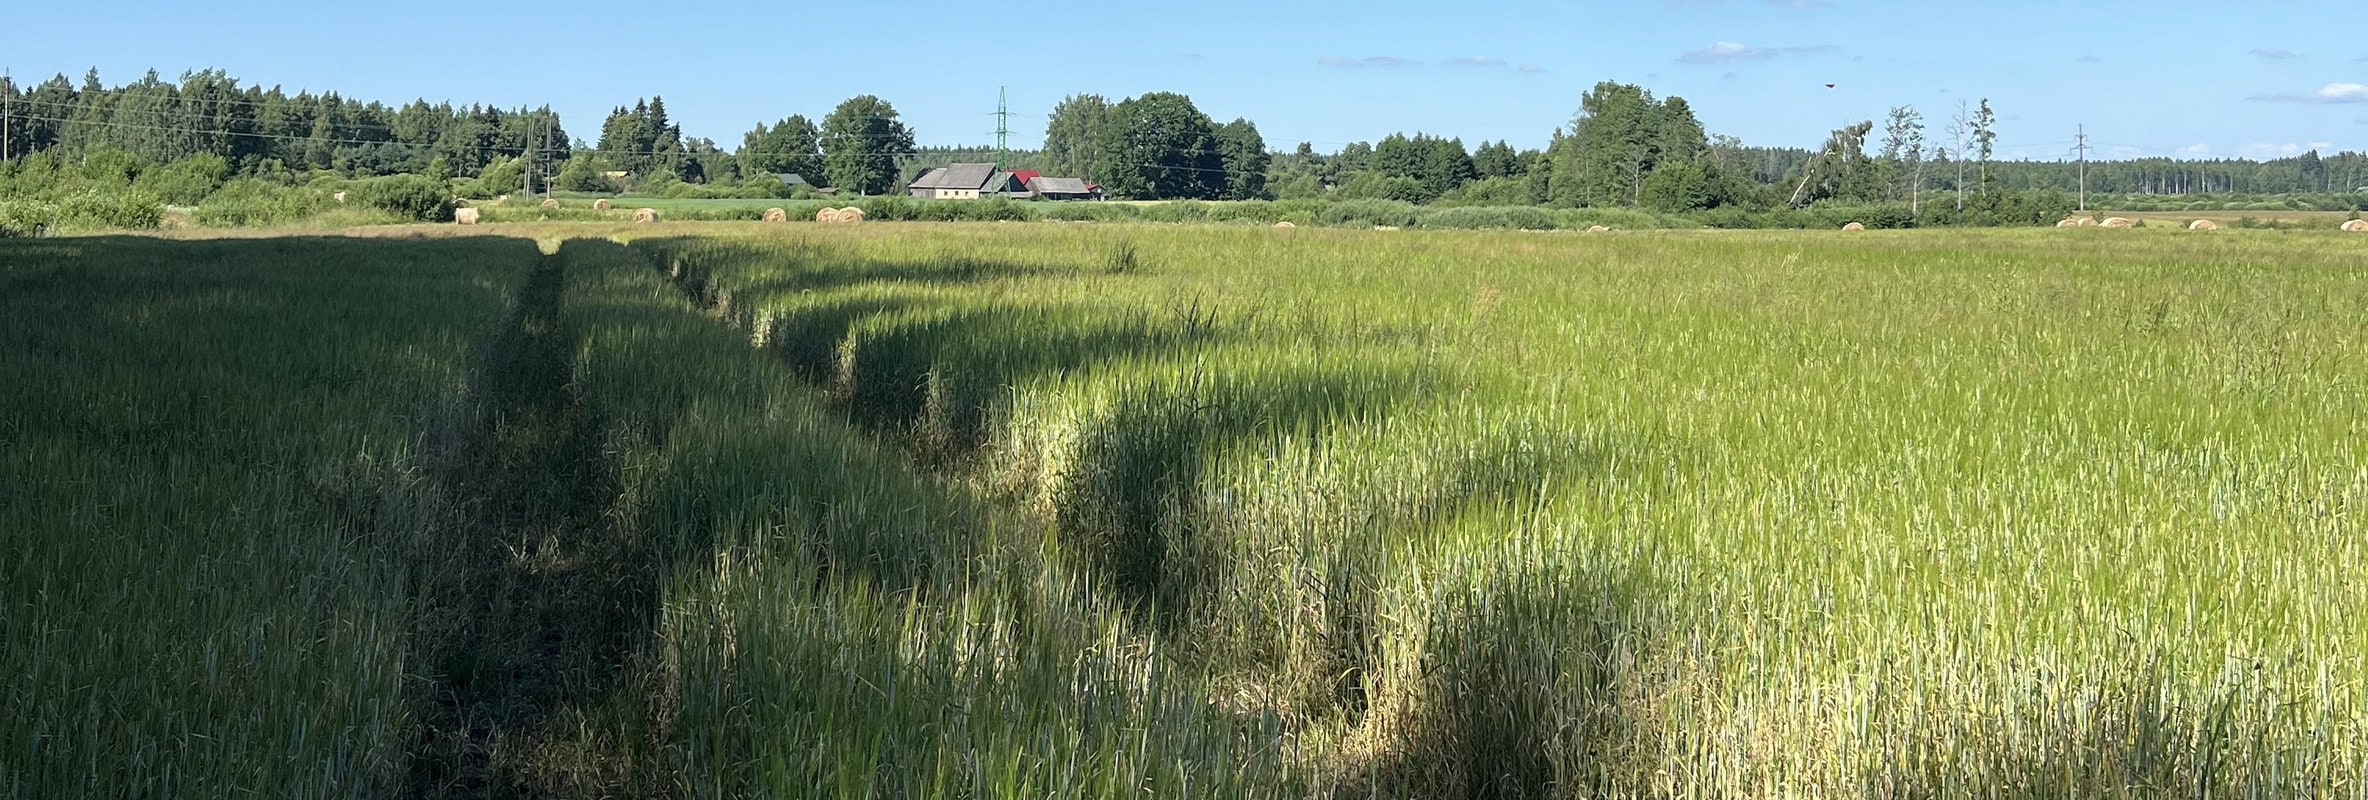
Take this oilseed rape field in Latvia. Over winter, parts of the crop froze out completely, and rape that has fully frozen out doesn’t come back. The agronomist knew that. What the satellite gave him was a map of the damage: exactly where the frozen patches were and how big. On the pictures they are the red and orange spots, and they were still there in May and June.

So the spring rate came from this season’s picture. The frozen patches got less nitrogen, because that rape wasn’t going to make it, and the fertilizer went to the plants that would. It’s different when you know the damage is only short-term, from a spray or a few hot days. The crop will pick up again and the field will go back to its usual pattern. You don’t want to react to damage that will be gone in a week, so the fresh picture isn’t the right base for your zones. Use the productivity potential map instead.
What you do with the satellite picture
Fertilizer. The satellite picture shows where the crop is strong and where it’s weak. You decide which zones get more nitrogen and which get less, so it goes where it turns into yield.
Growth regulator. A growth regulator usually holds back growth in the strong, lush parts of the field. In some cases you use it to help the crop tiller. Either way, the picture shows which zones are lush and which are thin, and you set the rate for each.
Fungicide. A dense crop has more leaf area to cover and less air moving through it, so it stays damp longer and disease spreads faster there. Put more product where the canopy is heavy and less where it’s open, always within the label rate.
From picture to zone map in a few clicks
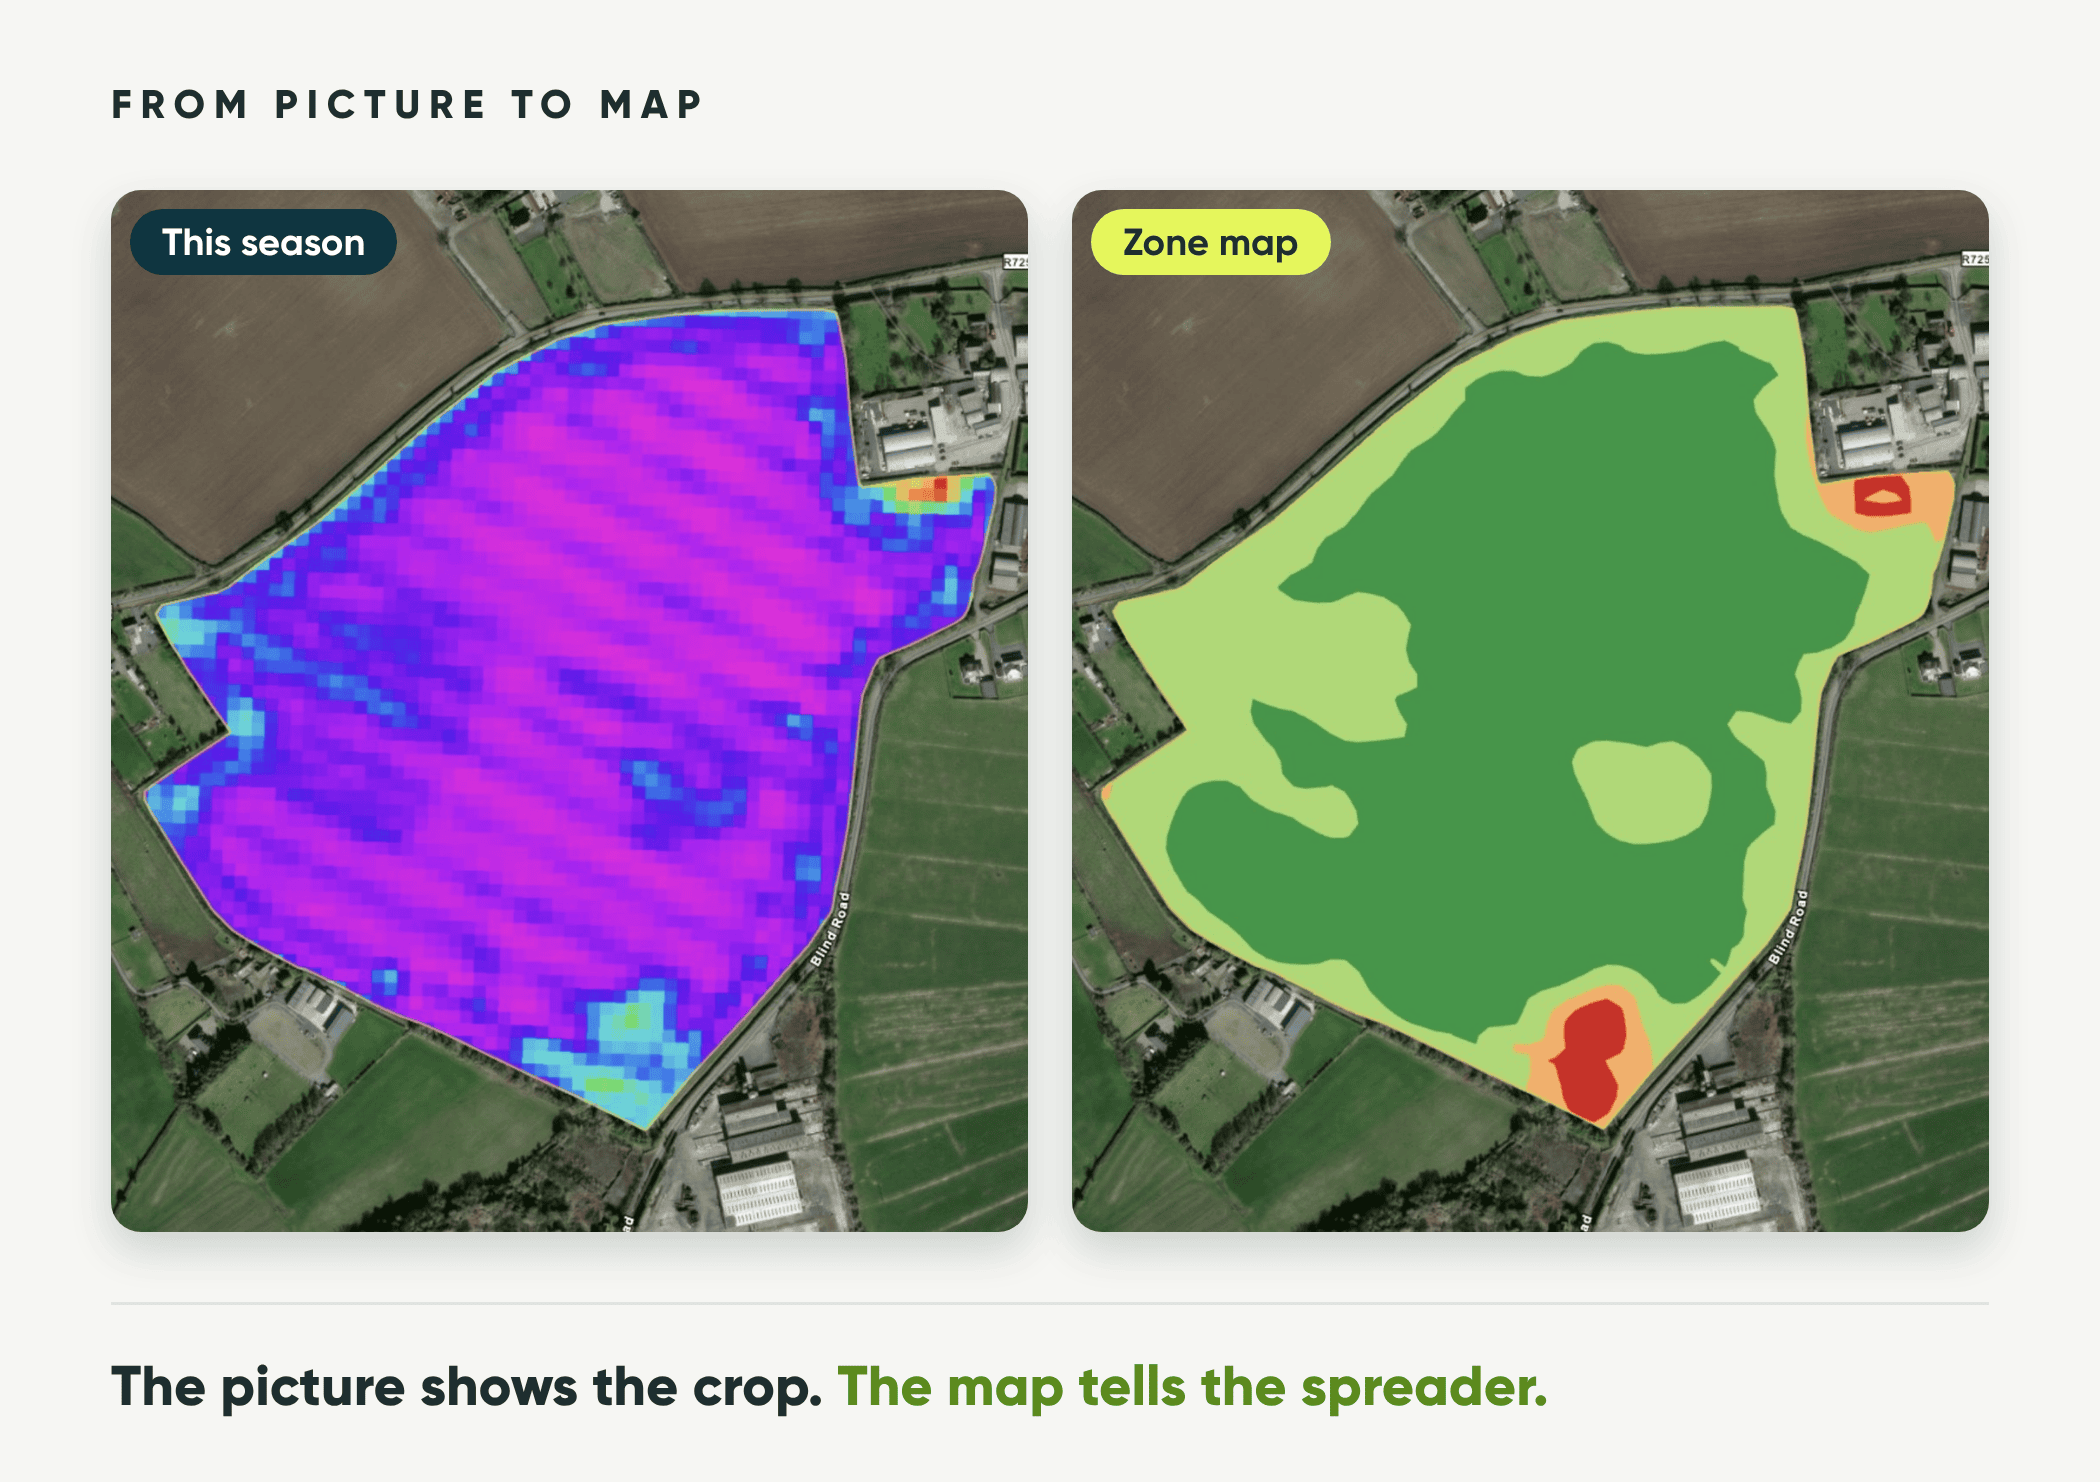
The CultiWise portal walks you through it step by step. You enter your average rate, and CultiWise makes the zones from the latest clear picture and works out the rate for each one. You can still raise or lower the rate for any zone.
Send the map to the terminal, and the machine changes the rate or switches sections off by itself as it drives. It works with any brand that can do variable rate or section control.
All your wheat at once
Ten wheat fields waiting for the first nitrogen dose? Set it up once and apply it to all of them. Each field still gets its own zones from its own latest picture. You see the total amount for each field, and export all the maps together.
Which field to harvest first
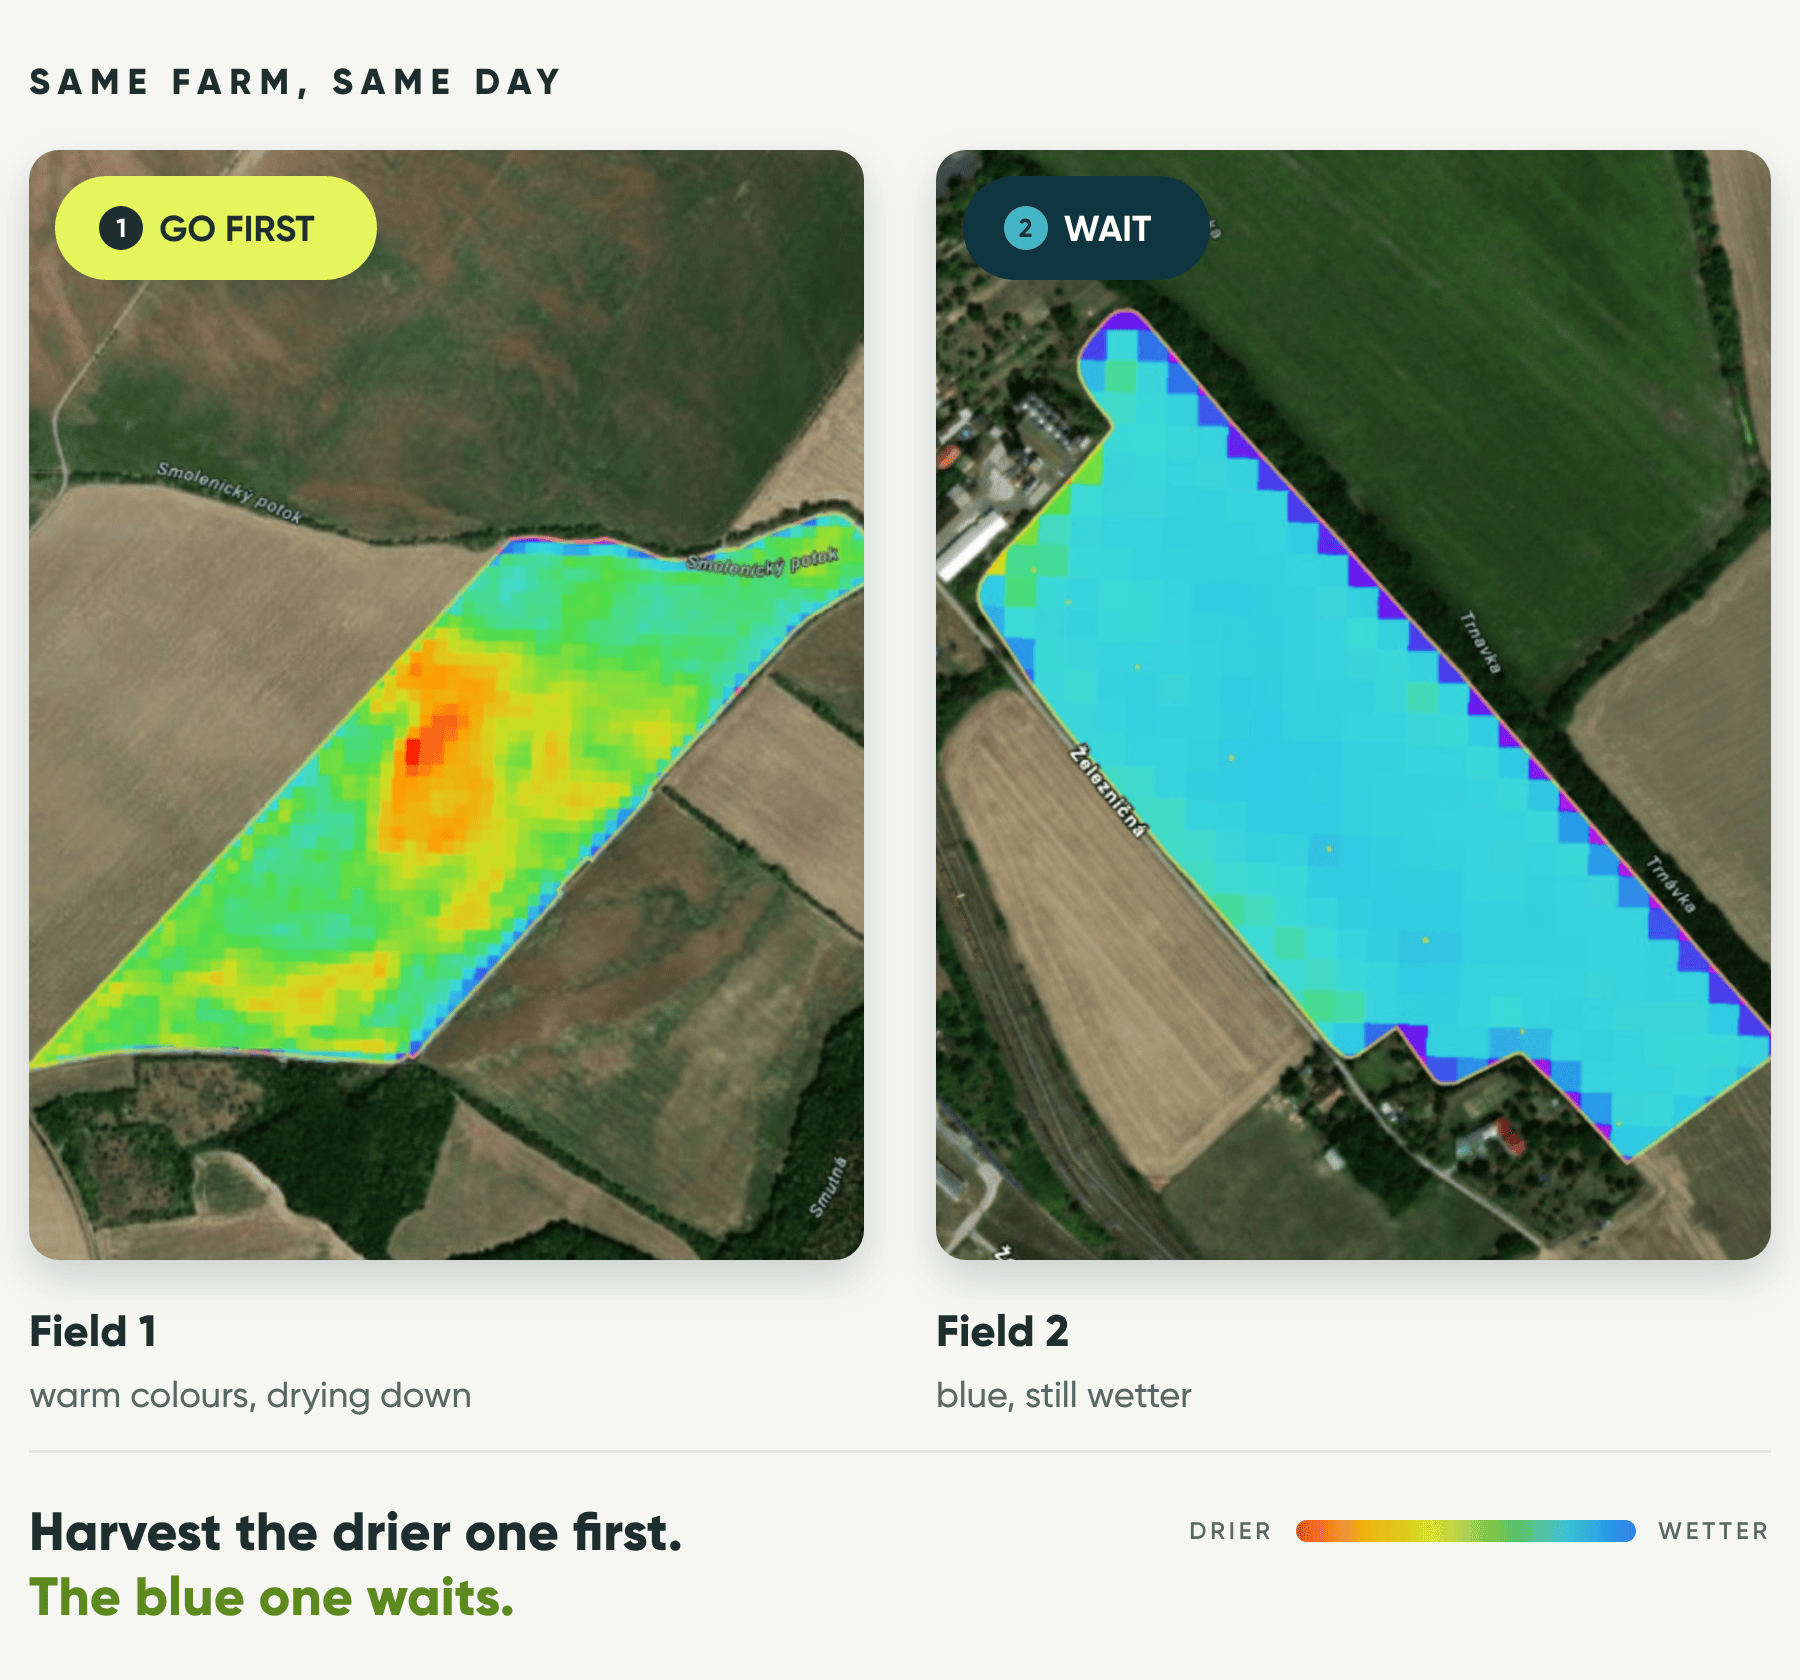
The satellite also shows which fields are drying down faster. On one farm in Slovakia, two winter wheat fields looked ready from the road. The satellite showed one drying down and the other still holding more moisture in the crop. The drier one went first. Just check the grain moisture before you cut.
Where the satellite stops
The satellite has two limits. The first is cloud. If it stays cloudy for days, there is no clear picture to work from.
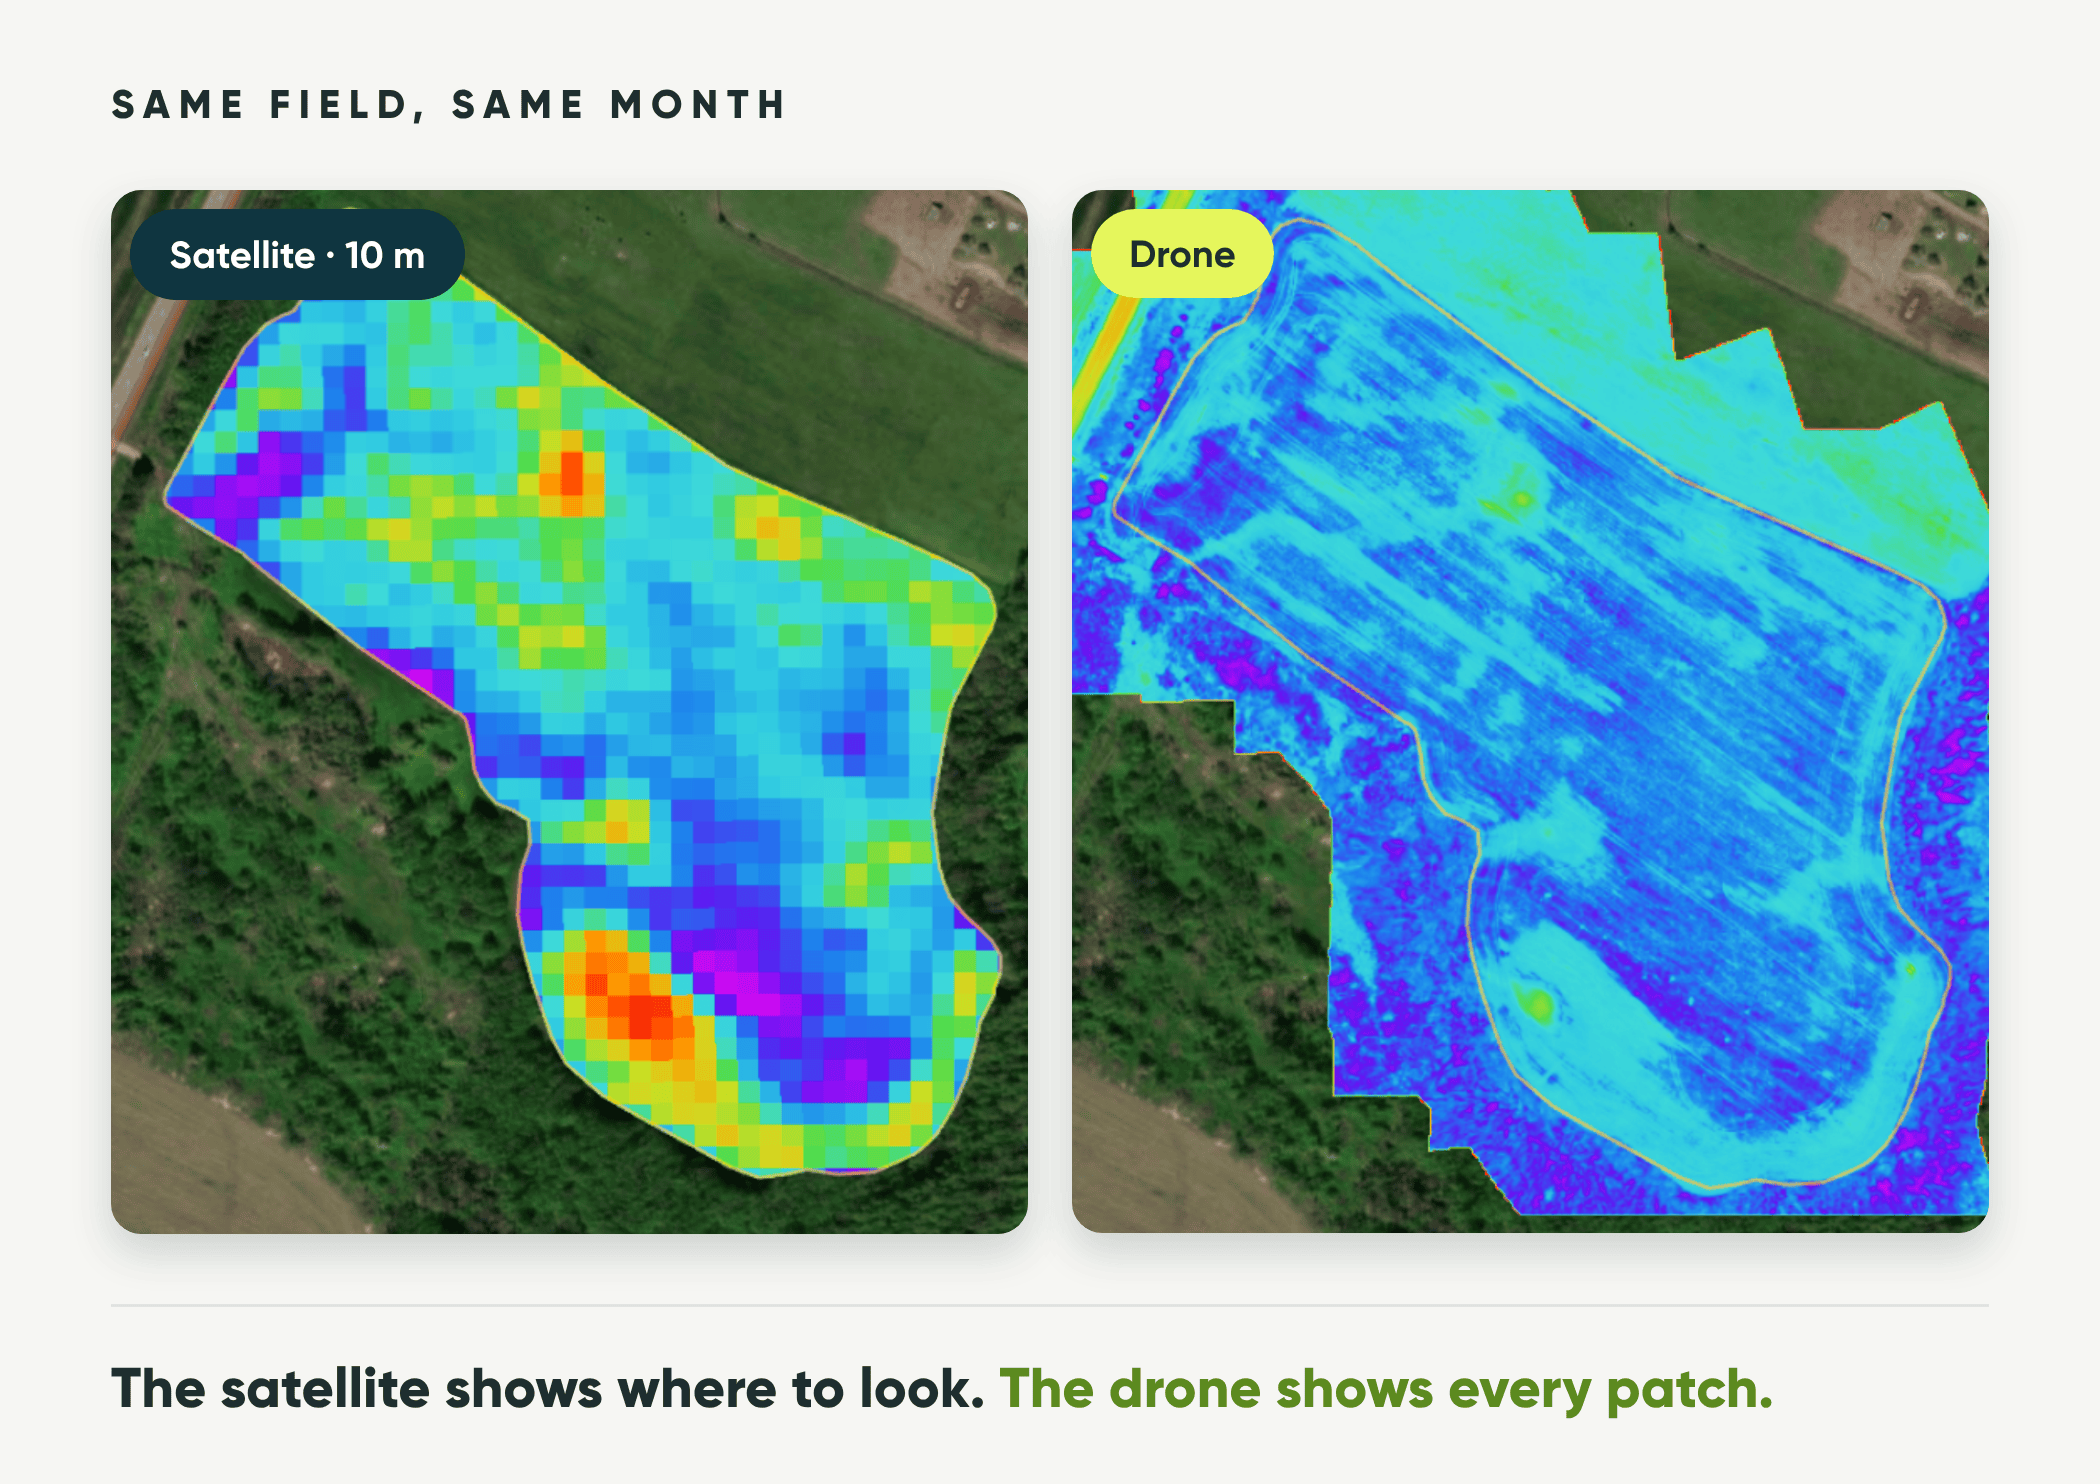
The second is detail. The satellite sees the field in 10 by 10 metre squares. That’s plenty to see where the crop is thick or thin and to build fertilizer zones, but not to find single weeds or count plants.
For both, there is the drone. It flies under the cloud and sees every plant. Here is the frozen-out rape again, from the satellite and from a drone in the same month. The drone sees far more, but the thin patches are in the same places. A spreader doesn’t place fertilizer to the centimetre, so for fertilizer zones the satellite is enough.
Open your fields today
Register for free at portal.cultiwise.com and add your field borders. The pictures are already there, and they’re free. Zone maps and the productivity potential map come with every paid plan, from Start up. Before your next application, open one field and see how the crop is doing.